Feeds:
Posts
Comments

Net Natural Decrease Approaching for Non-Hispanic Whites

Recent population estimates by age, race, gender and Hispanic origin for Maryland from the U.S. Census Bureau revealed that all of Maryland’s population growth in 2014, and indeed since 2010, was the result of the growth in minority populations, where minority is everyone other than non-Hispanic white alone.  Growth in Maryland was led by Hispanics, followed by African Americans, Asians and those of two or more races.  There was a decline in non-Hispanic whites due to net domestic outmigration.  (See Hispanics Continue to Lead Maryland’s Population Gain in 2014).
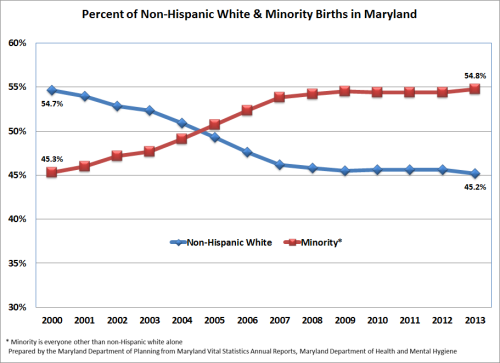
Percent of Non-Hispanic  White & Minority Births in Maryland

Percent of Non-Hispanic White & Minority Births in Maryland

Continue Reading »

The Census Bureau recently announced plans to eliminate the American Community Survey (ACS) three-year socioeconomic estimates for all areas over 20,000 persons.  These estimates are often used to evaluate current and past socioeconomic conditions in medium sized communities and the loss of this data set would be a blow to doing important, timely analysis.

The Census Bureau collects data annually for all geographies, but because the ACS sample size is not large enough to provide single year data for all areas, the data are reported for one-year, three-year and five-year time periods.  Continue Reading »

The overwhelming majority of Maryland’s population growth continues to occur in the four older suburban jurisdictions of Montgomery, Prince George’s, Anne Arundel and Baltimore counties, according to recently released population estimates for July 1, 2013 from the U.S. Bureau of the Census.[1]

Downtown Silver Spring in Montgomery County

Downtown Silver Spring in Montgomery County

The latest Census Bureau’s population estimates indicate that the effects of the Great Recession, which lasted from December 2007 to June 2009, and the collapse of the overheated housing market of the mid 2000s, are still being played out in the third year of the current decade.  Loss of jobs, followed by an anemic recovery, along with a housing market saddled with foreclosures and stricter mortgage loan standards, combined to greatly impact the ability of residents to move from current locations.  This reduced mobility had the greatest negative impact on rural/exurban counties in Western Maryland and on the Eastern Shore which in the past grew mostly from the migration of residents from other parts of Maryland.  The greatest positive impact was on the inner suburban counties, greatly reducing net out migration from the high levels experienced in the mid-2000s.

Continue Reading »

Non-Hispanic whites in Maryland make up a greater percentage of those eligible to vote than their share of the overall population, while all other races and Hispanic groups have smaller shares of the voter-eligible population. That finding comes from recently released data from the U.S. Census Bureau which estimates citizen voting age populations by non-Hispanic race and Hispanic origin.

Hispanics are an ethnic designation, not a racial designation, and can be any race.  They are not included in the race categories in order to avoid double counting. Continue Reading »

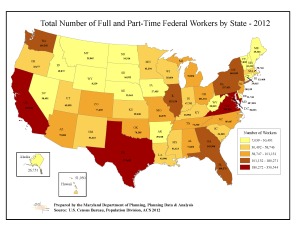
Map: Total Number of Full and Part-Time Federal Workers by State - 2012

Map: Total Number of Full and Part-Time Federal Workers by State – 2012 (click to open large map)

While it is no secret that the partial shutdown of the federal government and the furloughing of federal workers will have a disproportionate effect on Maryland, Virginia and the District of Columbia, other states will also feel the effects. Continue Reading »

Logo of the American Community Survey, a proje...

A Status Report on Maryland from the American Community Survey

Unemployment is down, income has stopped falling, more people have health insurance, and a smaller percentage of homeowners are “cost burdened.” That is some of the good news. But… unemployment remains stubbornly high for a recovery period, income is still well below pre‐recession levels and labor force participation continues to fall. That is some of the not so good news. Continue Reading »

Baltimore, Maryland Skyline from the Inner Harbor

Baltimore, Maryland Skyline from the Inner Harbor (Photo credit: Wikipedia)

Maryland’s population grew by more than 111,000 between 2010 and 2012, mainly due to gains in minority groups, according to U.S. Census Bureau estimates released in June.

In fact, Maryland is moving closer to becoming a majority‐minority state, with its minority share reaching 46.1 percent in 2012. Maryland has the seventh highest minority share in the country, significantly exceeding the U.S. national average of 37 percent.

Population gains in Maryland over the last year were led by increases in the Hispanic population Continue Reading »

As a share of total state residents, Maryland’s foreign born population has grown over four-fold over the past 50 years.

MDP graphic design intern, Sol Moon, worked with Mark Goldstein to produce the following infographic to tell the story of this demographic using U.S. Census Bureau decennial count (1850–2000) and 2008–2010 American Community Survey data. The information contained in this infograhic was patterned after one that was done for the U.S. by the Census Bureau.

FB_Header Continue Reading »

An article from the Baltimore Sun (March 24, 2013) that analyzes the population changes for Maryland’s counties.

Recession changed course of population growth in metro Baltimore – baltimoresun.com. Continue Reading »

As was reported in the Baltimore Sun, the Baltimore Business Journal and other news media last week, the U.S. Census Bureau released its annual population estimates for counties. The Maryland State Data Center released its tables and analyses on March 14, 2103. These can be found on the 2012 Population Estimates for Maryland’s Jurisdictions webpage.  The big news for Maryland was that Baltimore City is estimated to have grown by just over 1,100 residents Continue Reading »